MySQL Performance Schema Details
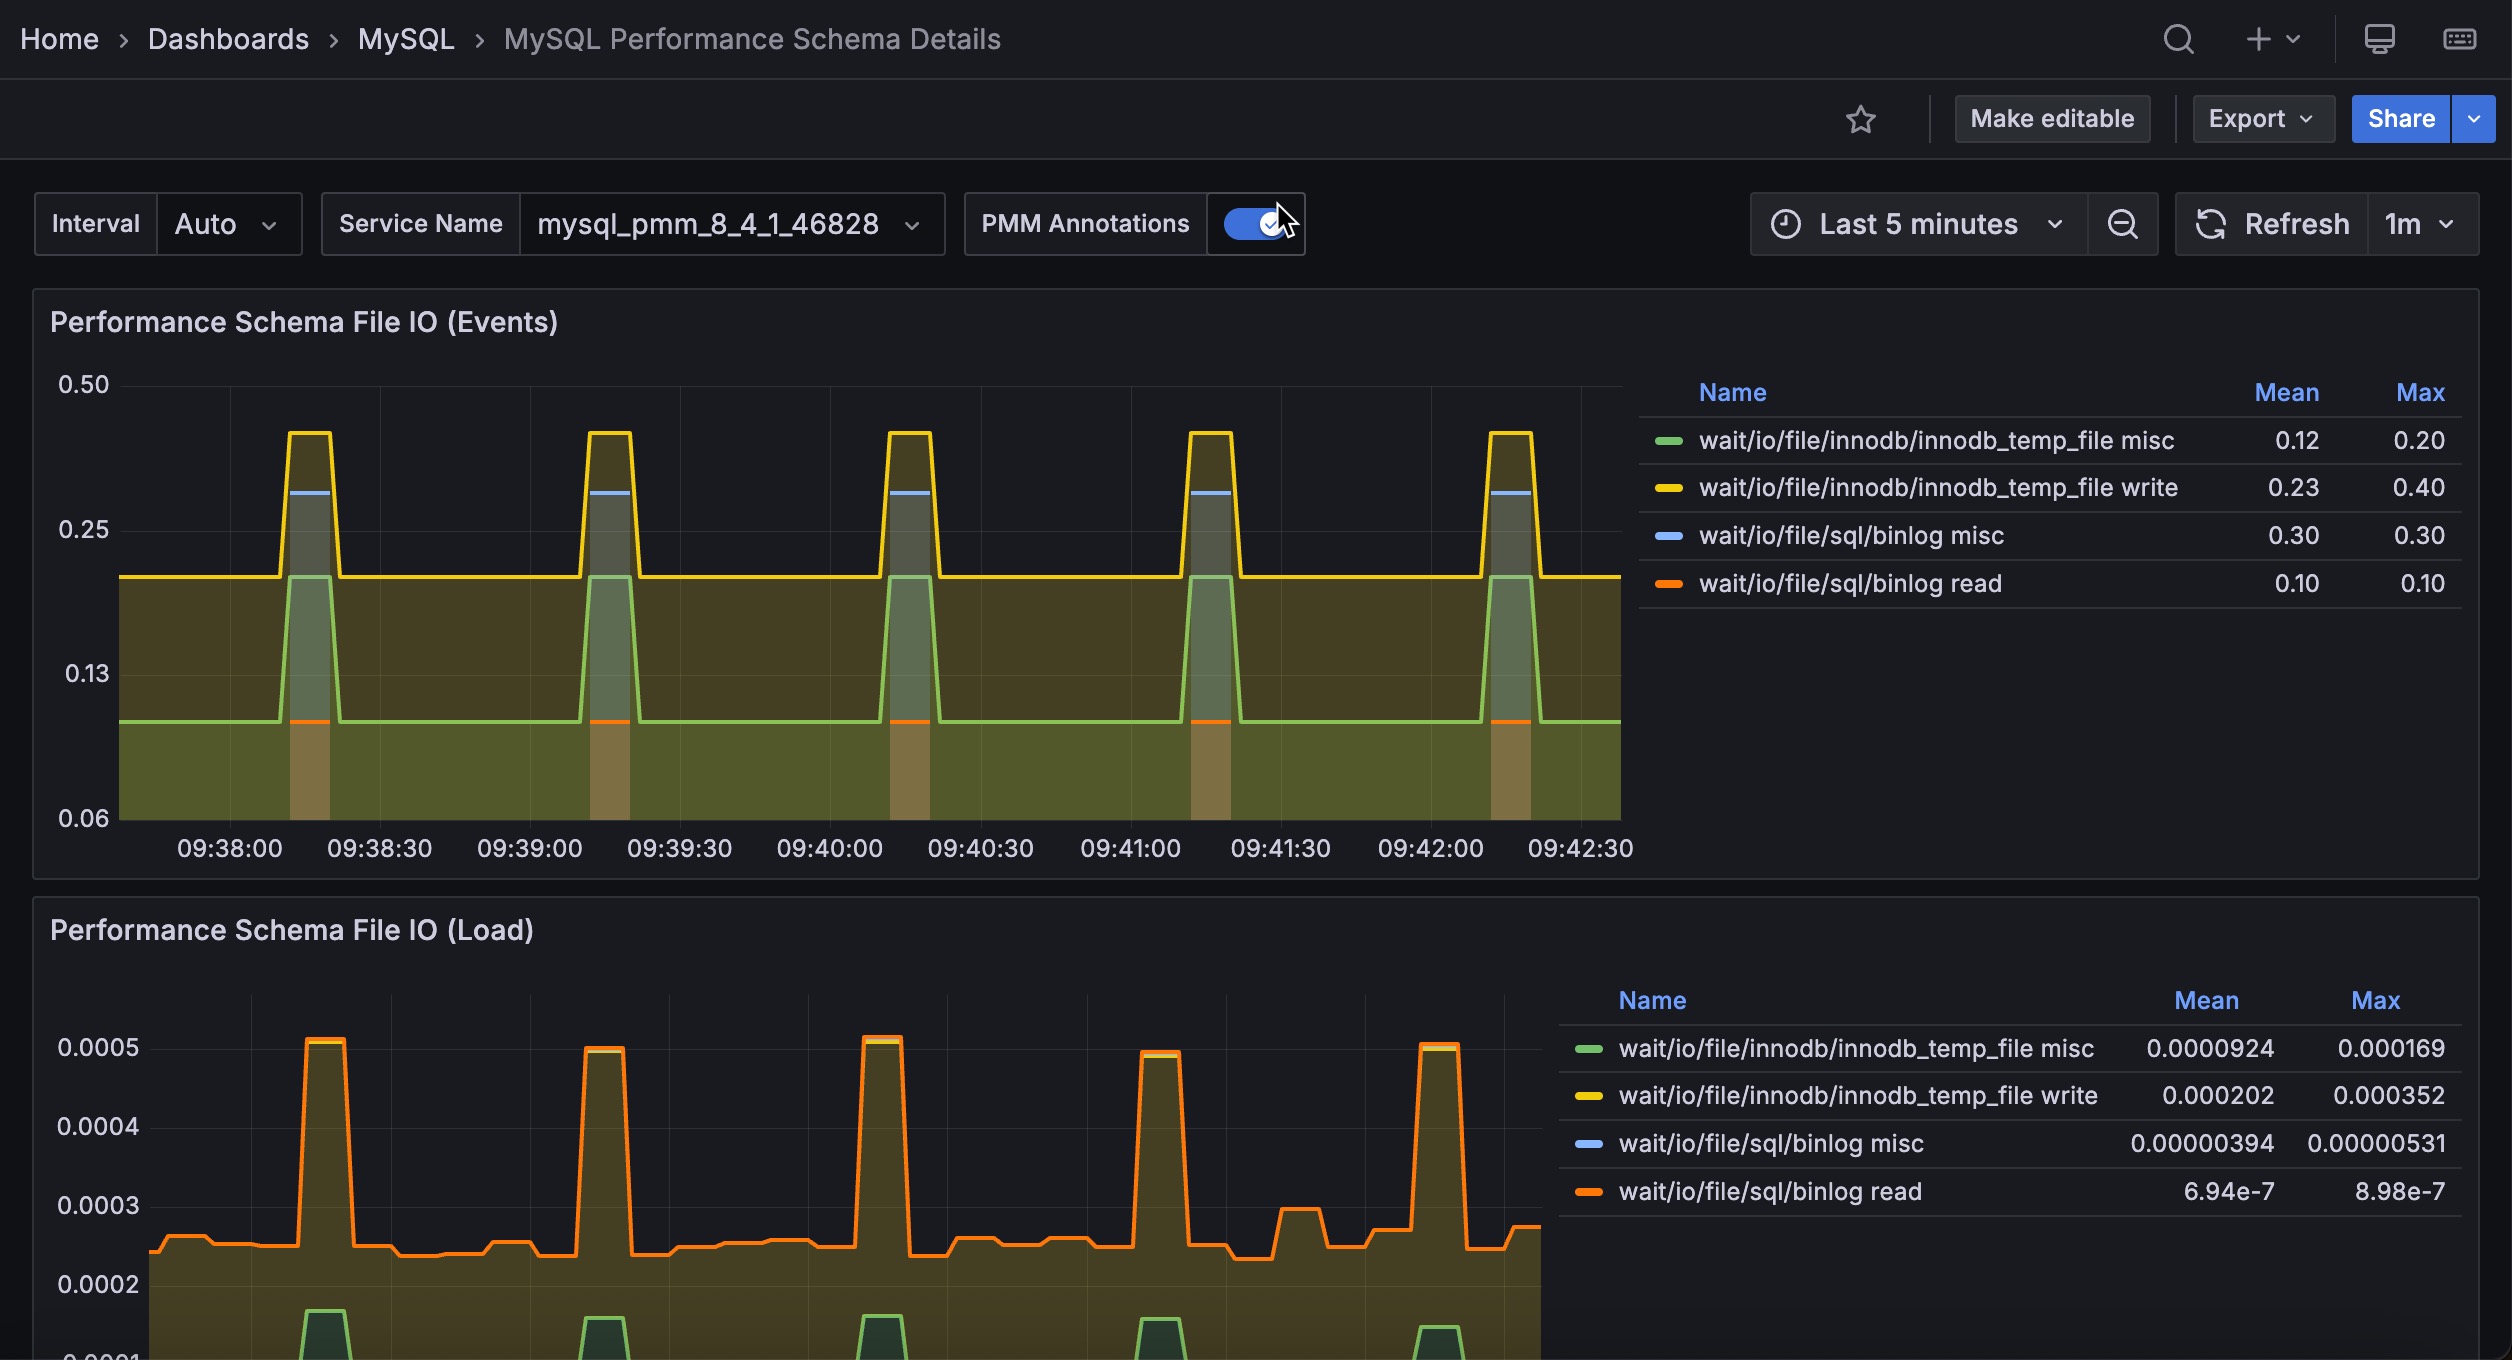
The MySQL Performance Schema dashboard helps determine the efficiency of communicating with Performance Schema. This dashboard contains the following metrics:
- Performance Schema file IO (events)
- Performance Schema file IO (load)
- Performance Schema file IO (Bytes)
- Performance Schema waits (events)
- Performance Schema waits (load)
- Index access operations (load)
- Table access operations (load)
- Performance Schema SQL and external locks (events)
- Performance Schema SQL and external locks (seconds)
- Performance Schema memory usage (current Bytes)
- Performance Schema memory allocation rate (Bytes)
- Performance Schema memory free rate (Bytes)
Performance Schema memory
The three memory panels break down server memory by Performance Schema memory instrument, using performance_schema.memory_summary_global_by_event_name. Use the Memory Event filter at the top of the dashboard to narrow the panels to specific instruments.
Server configuration required
Memory instruments are disabled by default in MySQL and Percona Server. Until they are enabled, these three panels show No data even though the rest of the dashboard is populated.
Enable them at server start-up with the performance-schema-instrument option:
performance_schema=ON
performance-schema-instrument='memory/%=ON'
performance-schema-instrument cannot be set in a session, so a server restart is required.